Accumulative Swing Index
The Accumulative Swing Index (ASI) is a trendline indicator used by technical traders to gauge the long-term trend in a security’s price, drawing on candlestick charts. The ASI uses the opening, closing, high, and low prices of each candlestick to generate a signal about the long-term trend.
The Accumulative Swing Index indicator is used to get a better confirmation of breakouts.
What is Accumulative Swing Index?
In simple words, the Accumulative Swing Index (ASI) is a technical indicator that is used to identify whether a market is in an uptrend or downtrend. The ASI is calculated using the highs and lows of each candlestick on a price chart. If the ASI is positive, it indicates that the market is in an uptrend. If the ASI is negative, it indicates that the market is in a downtrend.
What we currently see is an upgraded version of what Wilder created but of course, the principle remains the same. The Accumulative Swing Index (ASI) was developed by J. Welles Wilder to measure the breakout potential of a given market. The ASI is a number from 100 to -100 that shows whether prices are going up or down. A positive number means prices are going up, and a negative number means prices are going down.
The main advantage of the ASI is that it can be analyzed using the same technical tools as a candlestick chart, such as trendlines, wedges, triangles, etc. This makes it possible to identify support and resistance levels.
ASI charts are also simpler and smoother than candlestick charts, which makes them easier to read and less likely to show false breakouts.
When the ASI for a given day is bigger than the ASI from a previous breakout, it signals that a new breakout from the trend is about to happen. This is an opportunity for traders to take positions.
How to use the Accumulative Swing Index?
Full instructions for calculating the Swing Index and ASI are available in Wilder’s “New Concepts in Technical Trading Systems”, and a number of popular pieces of trading software are able to calculate the ASI automatically.
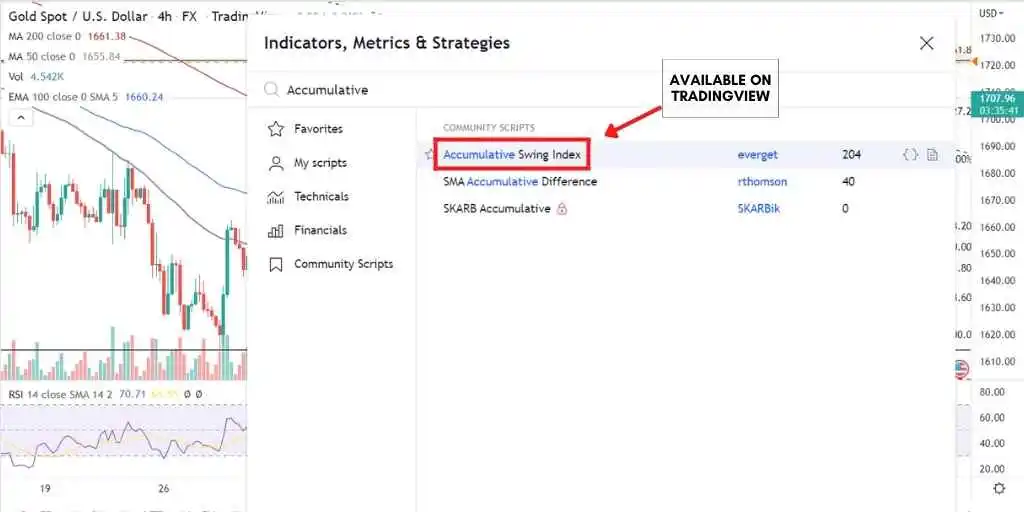
Just in case you are looking forward to getting complete instructions for calculating the Swing Index, it’s available on Wilder’s ” New concepts in technical trading systems”, well, I would recommend you to go to your tradingview account and search for ASI in indicators.