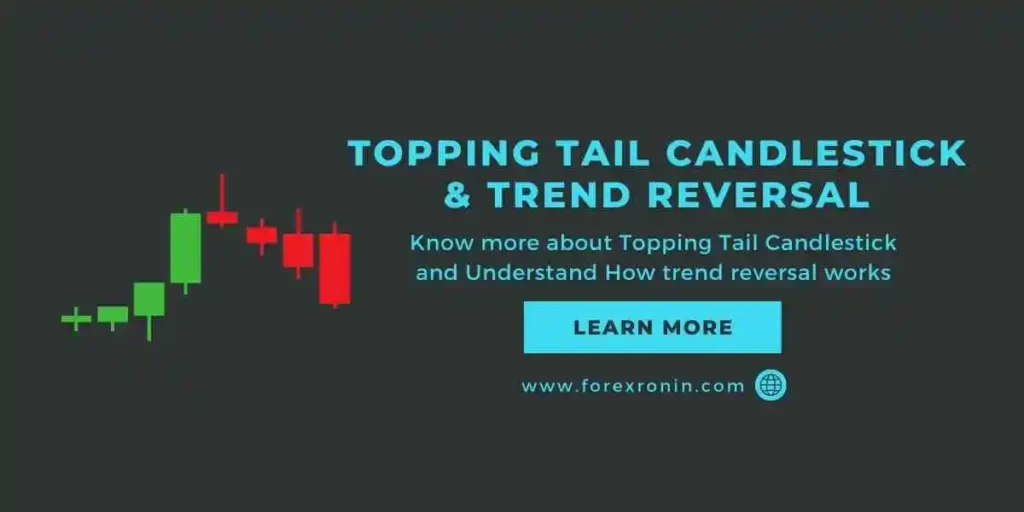
Topping Tail Candlestick Pattern can be considered as one of the crucial indicators in technical analysis. Just in case you are wondering if the topping tail candlestick pattern is similar to the Gravestone Doji, then you are right to some extent. As the name suggests topping tail candlestick pattern has a bottoming tail with a small body. Somewhat similar to what Gravestone Doji looks like.
Is Topping Tail candlestick pattern a strong indicator?
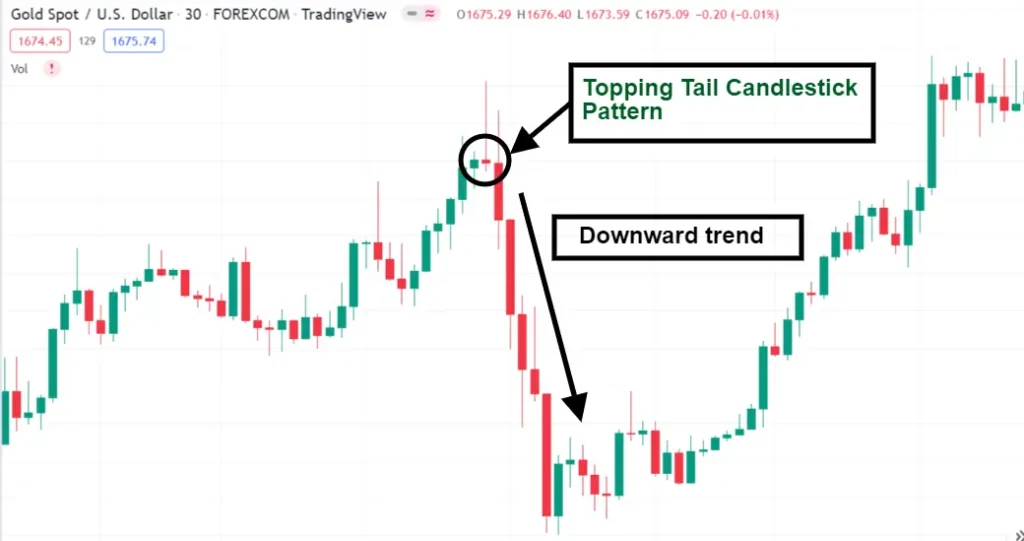
Yes, the Topping tail can be a good indication if seen on regions of resistance, think of this as a signal that indicates how a trend reversal is going to take place after continuing a bullish trend for a while. But remember that a single candlestick is not enough to make a trade. Remember before taking a trade, make your own trading plan and strategy and work on it.
So basically, topping tail candlestick is more of a bearish reversal signal, let’s take a more detailed look into that.
Bearish Reversal by Topping Tail Candlestick Pattern
If you look forward at the chart shown below, you can see that the candlestick formation on the resistance level can be a signal toward the potential reversal of an ongoing bullish trend. The topping tail basically shows the decline of the ongoing bullish trend and can help you identify things at right time, the TT candle shows an indication of how tghe stock market or the forex market is undergoing selling pressure.
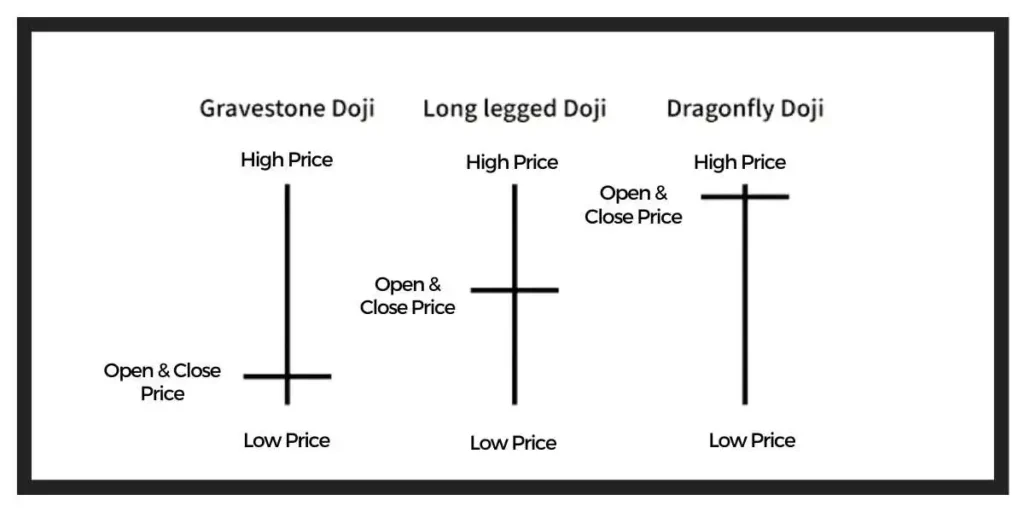
Is Topping Tail Candlestick similar to Doji?
Yes, Topping Tail Candlestick is similar to Doji. Both are reversal patterns that can be found at the top or bottom of a trend. They are both characterized by a small body with a long wick on one side. The main difference is that Topping Tail has a long wick on the top, while Doji has a long wick on the bottom (can also have one on the top).
For a clearer understanding, you can check the images shown below:
Do Candlesticks Work Well In Long-Term Charts?
Candlesticks are a popular tool among traders and investors, and they can be used in long-term charts to identify potential market reversals and trend changes. While candlesticks alone cannot predict the future direction of the market, they can be used in conjunction with other technical indicators to provide a more complete picture of the market.
Topping and bottoming tails in Forex trading
Topping and bottoming tails in trading are used to predict future market direction. If the market is trending upwards, a trader would look for a top tail to form, which would indicate a potential reversal. Similarly, if the market is trending downwards, a trader would look for a bottom tail to form, which would also indicate a potential reversal.
What is Momentum in Trading?
Momentum in trading is the speed or rate at which the price of a security or asset moves. It can be measured using various technical indicators, such as the Relative Strength Index (RSI) or Moving Average Convergence Divergence (MACD). Security (Currency pair in our case) with strong momentum will continue to move in the same direction, while currency pair with weak momentum may reverse direction. Traders often use momentum to identify trends and make trading decisions.
What is a Tailed position in Trading?
A tailed position in trading is when the trader has a position that is “out of the money” or not profitable. This can happen when the market moves against the trader, or when the trader’s stop-loss is hit. A tailed position can also be caused by slippage, which is when the order is filled at a worse price than expected.